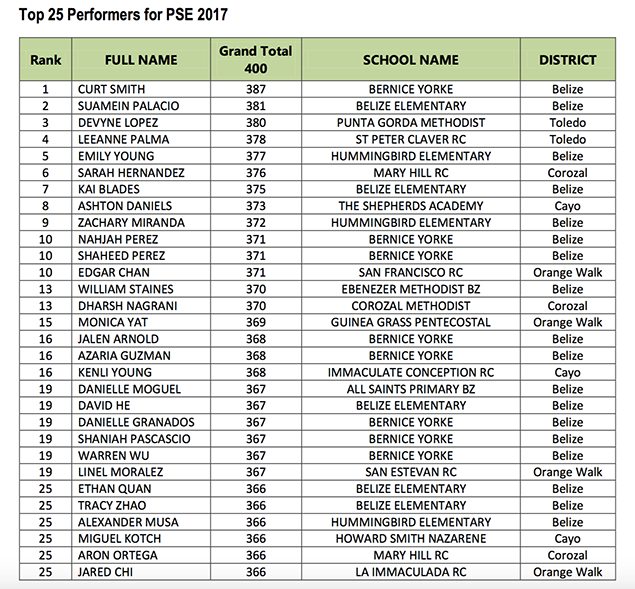
The Ministry of Education, Youth, Sports and Culture hereby issues the preliminary results of the 2017 Primary School Examination (PSE) which was administered countrywide on April 3, 2017 and May 2, 2017.
The Top 5 Performers for San Pedro and Caye Calker are as follows:
1st Place:
San Pedro R.C School: Kiona Sanker 363/400 = 90.7%
Island Academy: Collin Grief 363/400 = 90.7%
2nd Place:
Island Academy: Tellen Smith 358/400 = 89.5%
3rd Place:
San Pedro R.C School: Jacinto Bradley 357/400 = 89.2%
4th Place:
Island Academy: Alexandra Lausen 352/400 = 88%
5th Place:
San Pedro R.C School: Ninel Pacheco 350/400 = 87.5%
New Horizon Seven Day Adventist: Marilyn Cuellar 350/400 = 87.5%

Top 5 of San Pedro R.C School – Back Row: Axcel Patt, Luis Murray; Bottom Row: Ninel Pacheco, Jacinto Bradley, Kiona Sanker, Jayden Lopez

1st Place: Collin Grief From Island Academy

2nd Place: Tellen Smith from Island Academy
Student Population
A total of 7,271 candidates registered for the PSE of which 7,077 candidates actually sat all parts of the exam this year. Of the registered candidates, 3558 (49.8%) were male and 3585 (50.2%) were female. This year, there were 11 private candidates. PSE numbers for 2017 show that there were 121 less registered candidates than 2016. Of the 7,271 who were registered for the exam, 194 (or approximately 2.7%) were either fully absent, absent for part of the exam, had a Ungraded for the English Writing Paper or the Math Problem Solving Paper, had a No Result for at least one part of the exam, or a had a combination of Absent, Ungraded or No Result for different parts of the exam.
Purpose and Intended Use of the Primary School Examination
The PSE assesses achievement of curriculum content and skills in the four (4) areas of English, Mathematics, Social Studies and Science of the National Primary School Curriculum. The examination is criterion-referenced meaning that performance of “each individual is compared with a preset standard for acceptable achievement…The performance of other examinees is irrelevant.” In this way, the examination seeks not to rank students in comparison to other students (as in norm- referencing) but to report what each student has achieved for individual subjects. This is expressed as a percentage score. The results of the examination are intended to be used for two main purposes:
1. Certificationofstudentsatthecompletionofprimaryschoolinginfourcontentareasofthe primary curriculum; and
2. Educational decision-making to inform policy, planning and practice at national, district, school and classroom levels.
The PSE is not and was never intended to be used as the sole criteria for entrance into secondary schools. Secondary schools are advised to use multiple sources of evidence of students’ achievement and holistic development at primary school to get a more complete picture of the students’ abilities, strengths and weaknesses in informing educational decisions with respect to the students they enroll and serve.
While the Ministry of Education will be recognizing outstanding students who have done well on the PSE, the Ministry of Education cautions that making judgments about schools and teachers on the basis of individual student performances is inappropriate. In the first instance, the performance of one or a few students may not be reflective of the whole school, and secondly schools are not all the same. Therefore making judgments of individual schools’ effectiveness on this basis without considering inputs (resources) available to individual schools and without considering background and contextual factors (socio-economic and family backgrounds and communities in which schools are located) of each school is not only inappropriate, but unfair.
Additionally, there is a tendency to either praise or criticize the Standard six teachers depending on the performance of students on the PSE. The Ministry of Education wishes to note that it is the school as a whole, and not individual teachers that is responsible for delivering the curriculum—educating the students and thus for the performance of students on the PSE.
Teachers should, therefore, not be considered independent practitioners, like general practitioner doctors, for whom the school is simply a base. Therefore, the school is to be viewed as a team of teachers led by a principal who is an instructional as well as administrative leader with the school’s management being responsible for monitoring and providing support. Schools, teachers and managements should take ownership for their performance as a school and should avoid using resources (or lack thereof) and students’ background and contextual factors to justify their performance. It is quite likely that for every school that ‘blames’ its performance on any of these factors that there is another very similar school that is doing better. Furthermore, there should be collective responsibility and ownership for the school’s performance and a culture that always seeks improvements in the quality of education delivered.
What the PSE Attempts to Assess/Measure
Following from the purpose of the PSE, the construction of the examination is guided by a table of specifications which specifies what curriculum content and skills are to be tested, that is, what curriculum content and skills will form the basis of the questions set. See attached annexes for
Table of Specifications.
The Primary School Examination Results for 2017
Below are tables showing various statistics for this year’s PSE as well a 10-year trend of performance by subject and statistics for each district and the country as a whole. Scores are interpreted according to the following grade bands indicating different levels of achievement/performance.
Letter Grade Description (Grade Range/Band)
A Excellent (80-100%)
B Competent (70-79%)
C Satisfactory (60-69%)
D Adequate (50-59%)
E Inadequate (49% and below)
National Performance on PSE by Subjects
Table 1: Performance in English
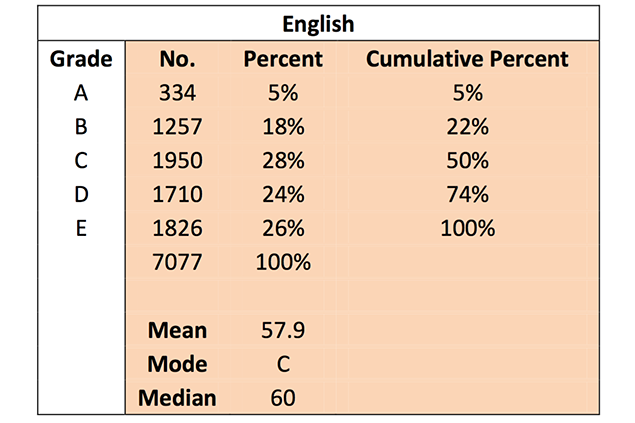
Half of the students (50%) sitting this year’s test scored a Satisfactory Level of Performance or better (grade C or better). The mean score remains in the Adequate range, with a negligible increase from 57.8 in 2016, to 57.9 this year. The gaps among the Satisfactory, Adequate and Inadequate ranges remain close, with the Mode being within the C (Satisfactory) range.
Table 2: Performance in Math
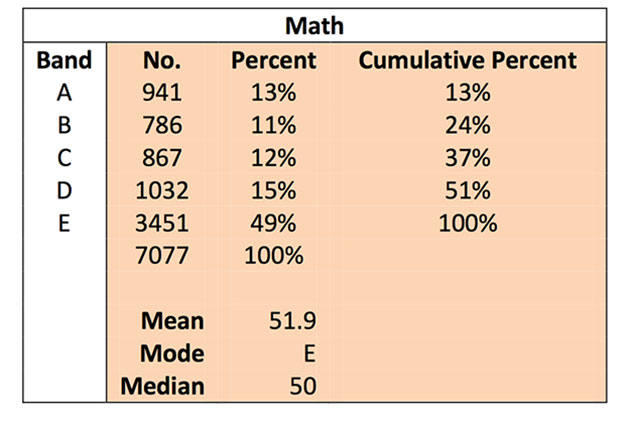
In Math, approximately 37% of students scored a Satisfactory Level of Performance or better (Grade C or better). This result is a 2% increase in performance from 2016 in Mathematics. The majority (49%) of students’ scores were in the E (Inadequate) range; this is still a concern even though there was a 1% decrease of the number of students who scored in this range in 2016. The Ministry is undertaking remedial action in this area as indicated further in this report.
The Mean score increased slightly from 50.6% in 2016, to 51.9% this year.
Table 3: Performance in Social Studies
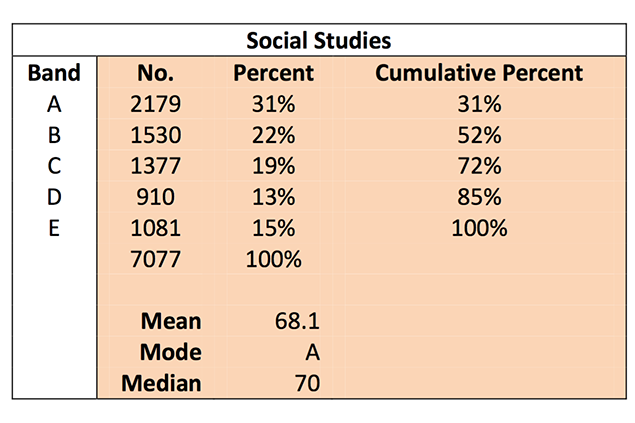
Performance in Social Studies showed a marked increase in the number of students (31%) whose scores were in the A (Excellent) range. This is notable, as last year 21% of students’ scores were in the same range. Likewise, the mean score increased from 63.7% in 2016 to 68.1% this year.
The mode grade range of A indicates that most students scored within the Excellent range, a shift from the B (Competent) range of 2016.
Table 4: Performance in Science
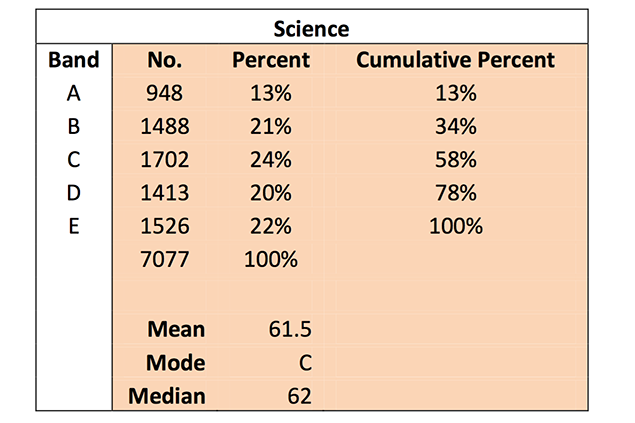
This year’s scores for Science decreased markedly. In 2016, 70% of students scored in the Satisfactory or above ranges; this year’s performance showed only 58% of test-takers in the same ranges, with the number of students in the Excellent range falling from 28% in 2016 to 13% in 2017. Notably, the Mode shifted from the Excellent (A) range in 2016 to Satisfactory (C) this year.
Trends in Mean Performance
The graph below shows the trends in mean performance by subject since 2008.
Graph 1: English
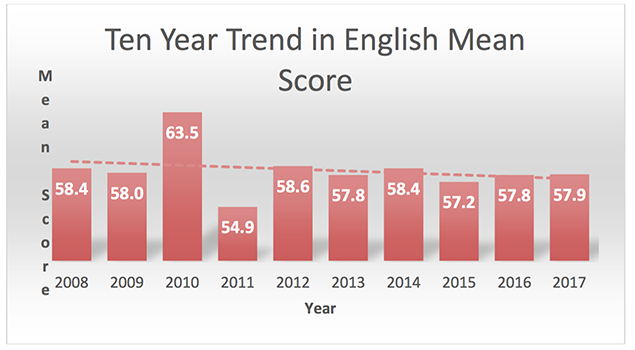
Performance in English has remained more or less very stable, with annual fluctuations, showing only a very slight upward trend.
Graph 2: Math
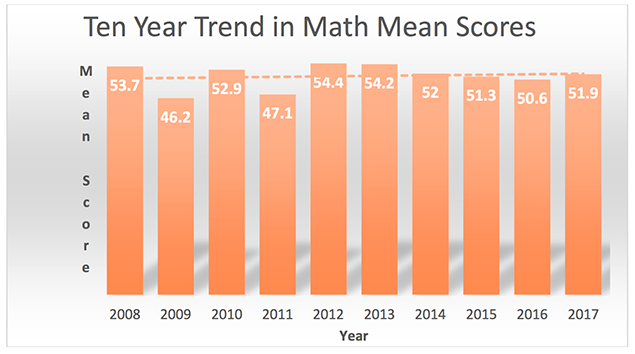
For Math, the national mean score has remained more or less constant over the ten years shown with spikes in 2008, 2010, 2012 and 2013. While mean performance in 2017 is just above 50, as it has been for the last two years, and the last three years represent an overall increase over previous years generally (apart from the mentioned spikes), it is still of great concern that most students are scoring in the grade E band which represents inadequate performance.
Graph 3: Social Studies
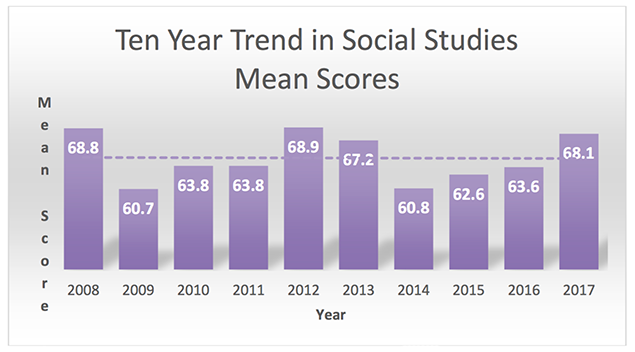
In Social Studies, the scores have fluctuated within the Satisfactory range. A sharp increase within the same range was noted in 2008, and was followed by a sharp decrease in 2009. Since that year, there have been modest improvements in performance. Scores for this subject since 2014 appear to show slight increases with this year’s mean score (68.1%) up from 63.6% in 2016.
Graph 4: Science
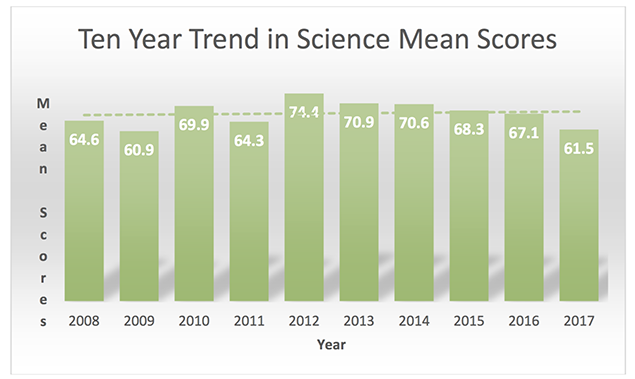
Since 2008, the Science mean scores remained more or less stable within the Satisfactory and Competent levels of performance. However, the Ministry has noted the steadily decreasing Mean scores over the last five years.
NOTE:
While the tables of specification that guide the construction of an exam help to ensure that more or less similar content and skills are tested each year no two PSE examinations are exactly alike. Therefore, while each year’s examination is similar to the previous in the content and skills assessed and hence presumed difficulty, caution should be taken in interpreting trends as the difficulty of the exam may vary from year to year. Procedures for equating the difficulty of the examinations each year for a more reliable interpretation of trends are not yet in place.
USING THE EXAMINATION RESULTS TO IMPROVE TEACHING AND LEARNING:
WHAT IS TO BE DONE
The results show that national mean performance by subject on PSE has remained more or less stable over the last ten years. It is important to note, however, that means or averages do not necessarily give the most complete picture of performance. It is, therefore, important to note how our students are distributed across the various grade ranges/bands, which is shown in the tables for each subject earlier in this release. For example, the Ministry has noted with concern in the past and again this year, that roughly half of our students score below the Satisfactory Level of Performance (Grade C) in English. Similarly, 60% or more of our students have tended to score below a Grade C in Math.
All concerned—teachers, principals, parents, managements and the Ministry of Education, Youth, Sports and Culture—must take ownership for the quality of education in our schools. The Ministry of Education, continues to expand its efforts to provide relevant and quality education to all children. Under the Education Quality Improvement Program (EQIP), primary school teachers nationwide are being trained in student-centered methodologies to improve learning. A feedback system to inform Teacher Education Institutions (TEIs) on the performance of their graduates and to improve the quality of teacher education programs is also in development. These projects are among many that are being implemented including initiatives to revise and improve the national primary curriculum and providing training to teachers and principals on proper curriculum planning and attention to student learning outcomes.
While the Ministry of Education has taken the lead in these endeavors, it is also the responsibility of the managements and individual schools to analyze their own school results to determine areas of strengths and weaknesses and to plan and implement interventions to address the areas of weakness. This must be done with a sense of collective responsibility.
